2019 Western Pacific typhoon season
Typhoon Bualoi 2019
Recorded track and intensity from Oct 17, 2019 to Oct 26, 2019

Drag to pan. Pinch or Ctrl/⌘ + scroll to zoom. Keyboard: plus or minus to zoom, arrow keys to pan, and 0 to show the full track.
161 mph
Oct 22, 2019 during the tropical stage
Full archive record, including non-tropical stages if present
Along the recorded center positions
STORM HISTORY
Track and intensity summary
Bualoi is listed in the Western Pacific basin for the 2019 season. Its archived track begins on Oct 17, 2019, 06:00 AM UTC at 7.9°N, 168.6°E. The first observation lists sustained winds of 17 mph. These dates describe the available observations, which may include stages before and after the tropical cyclone phase.
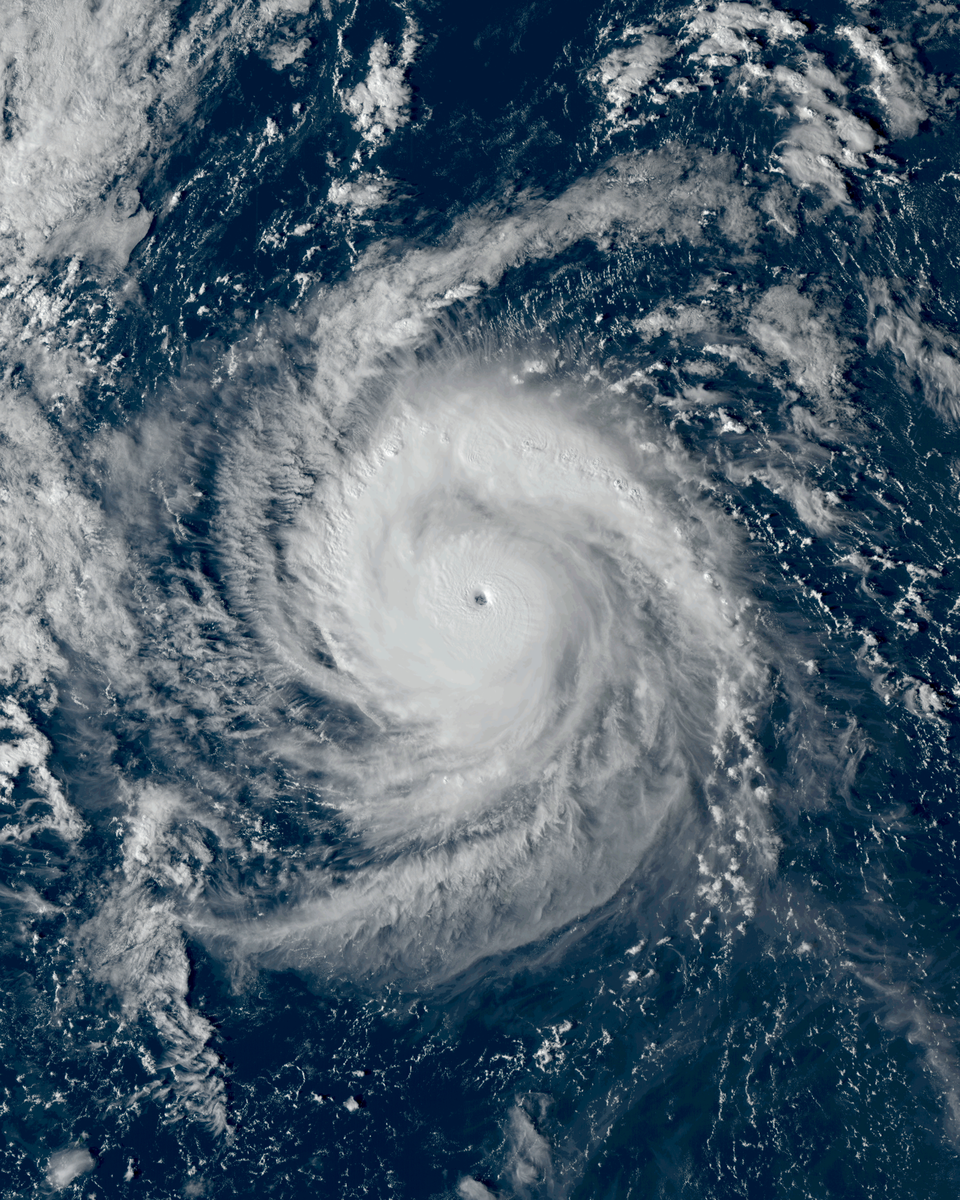
The first Category 5 observation appears on Oct 22, 2019, 09:00 AM UTC. The highest recorded tropical-stage one-minute sustained wind is 161 mph, first recorded on Oct 22, 2019, 09:00 AM UTC at 18.7°N, 144°E. The minimum recorded tropical-stage central pressure is 922 hPa on Oct 22, 2019, 09:00 AM UTC.
The full record spans 210 hours and approximately 3,460 mi along the recorded center positions. The last recorded position is 38.5°N, 149.4°E on Oct 26, 2019, 12:00 AM UTC. The final tropical-stage observation is earlier, on Oct 25, 2019, 09:00 AM UTC.
Further reading
QUICK ANSWERS
Bualoi in brief
What was Typhoon Bualoi's highest wind speed?
161 mph, the highest one-minute sustained wind in its tropical stage, recorded on Oct 22, 2019, 09:00 AM UTC.
What category was Typhoon Bualoi?
Category 5 at its peak on the Saffir–Simpson one-minute wind scale, first reaching Category 5 on Oct 22, 2019, 09:00 AM UTC. Other agencies classify storms differently.
What was Typhoon Bualoi's lowest pressure?
922 mb, the minimum central pressure recorded during its tropical stage, on Oct 22, 2019, 09:00 AM UTC.
When did Typhoon Bualoi occur?
The archived track runs from Oct 17, 2019, 06:00 AM UTC to Oct 26, 2019, 12:00 AM UTC, with the tropical stage from Oct 18, 2019, 06:00 PM UTC to Oct 25, 2019, 09:00 AM UTC.
Where did Typhoon Bualoi form?
In the Western Pacific basin, in the 2019 season. Its first archived position is 7.9°N, 168.6°E on Oct 17, 2019, 06:00 AM UTC.
Did Typhoon Bualoi make landfall?
No archived position places Typhoon Bualoi's center over land, but positions are six-hourly and a brief landfall can fall between them.
METHODOLOGY
Data sources and limitations
The map and summary are generated from NOAA's IBTrACS v04r01 archive. Wind and category use US-agency records; minimum pressure is calculated during the tropical stage, with the archive's pressure source retained. Category 5 refers to the Saffir–Simpson one-minute wind scale; local agencies may use different classifications. Coastlines use Natural Earth's 1:10m land data.
Track distance adds great-circle distances between consecutive observations, excluding gaps over 12 hours. This track has no gaps over 12 hours. The line shows the storm's center, not its size, rainfall or flood extent. Converted wind speeds are rounded to the nearest whole unit.
Archive retrieved
NOAA IBTrACS archive and Field documentation
Sources & methodology