1961 North Atlantic hurricane season
Hurricane Hattie 1961
Hurricane Hattie devastated British Honduras, now Belize, in October 1961. Wind and storm surge wrecked much of Belize City, leaving thousands homeless. The destruction helped prompt the eventual relocation of the national capital inland to Belmopan.

Drag to pan. Pinch or Ctrl/⌘ + scroll to zoom. Keyboard: plus or minus to zoom, arrow keys to pan, and 0 to show the full track.
167 mph
Oct 31, 1961 during the tropical stage
Full archive record, including non-tropical stages if present
Along the recorded center positions
STORM HISTORY
A Caribbean hurricane turns west
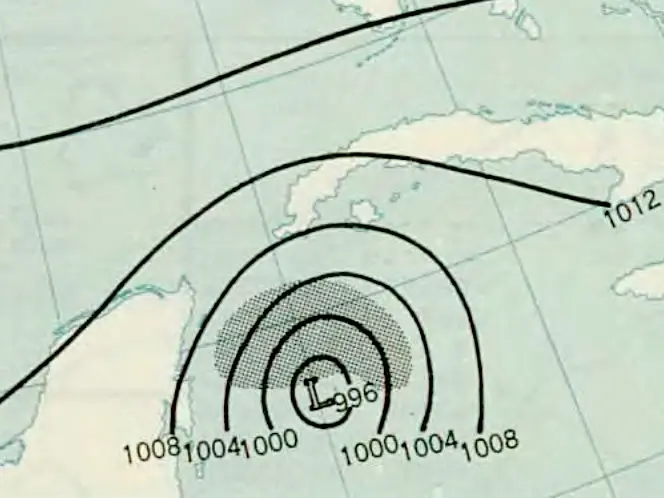
Hattie developed in the southwestern Caribbean and moved north past San Andrés. Forecasters initially expected a threat to Cuba, but a strengthening ridge turned the hurricane west toward Central America. The archive records peak one-minute winds of 145 kt and a minimum pressure of 914 hPa at 00:00 UTC on 31 October.
Destruction around Belize City
Hattie weakened to Category 4 before coming ashore south of Belize City on 31 October. Powerful surge flooded the city as wind damaged buildings. The territorial governor estimated that 70 percent of its buildings suffered damage, and more than 10,000 residents lost their homes.
The reported toll in British Honduras was 307 deaths and about US$60 million in losses in 1961 dollars. Early warnings helped keep deaths below the toll of the 1931 hurricane despite the scale of destruction. Hattie weakened over Central America's mountains and dissipated on 1 November.
A new capital inland
The devastation exposed Belize City's vulnerability to coastal flooding. Authorities later moved the government inland to the new city of Belmopan, giving Hattie a lasting role in the country's geography and political history.
IMPACT
Reported impact
| Areas affected | Honduras |
|---|
Facts from Wikidata.
Further reading
QUICK ANSWERS
Hattie in brief
What was Hurricane Hattie's highest wind speed?
167 mph, the highest one-minute sustained wind in its tropical stage, recorded on Oct 31, 1961, 12:00 AM UTC.
What category was Hurricane Hattie?
Category 5 at its peak on the Saffir–Simpson one-minute wind scale, first reaching Category 5 on Oct 30, 1961, 09:00 PM UTC. Other agencies classify storms differently.
What was Hurricane Hattie's lowest pressure?
914 mb, the minimum central pressure recorded during its tropical stage, on Oct 31, 1961, 12:00 AM UTC.
When did Hurricane Hattie occur?
The archived track runs from Oct 26, 1961, 12:00 AM UTC to Nov 1, 1961, 06:00 AM UTC, with the tropical stage from Oct 26, 1961, 12:00 AM UTC to Nov 1, 1961, 06:00 AM UTC.
Where did Hurricane Hattie form?
In the North Atlantic basin, in the 1961 season. Its first archived position is 10.5°N, 79°W on Oct 26, 1961, 12:00 AM UTC.
Did Hurricane Hattie make landfall?
The archive places its center over land at 1 recorded position; the strongest is 150 mph on Oct 31, 1961, 12:00 PM UTC. Positions are six-hourly, so this is not a landfall chronology.
METHODOLOGY
Data sources and limitations
The map and summary are generated from NOAA's IBTrACS v04r01 archive. Wind and category use US-agency records; minimum pressure is calculated during the tropical stage, with the archive's pressure source retained. Category 5 refers to the Saffir–Simpson one-minute wind scale; local agencies may use different classifications. Coastlines use Natural Earth's 1:10m land data.
Track distance adds great-circle distances between consecutive observations, excluding gaps over 12 hours. This track has no gaps over 12 hours. The line shows the storm's center, not its size, rainfall or flood extent. Converted wind speeds are rounded to the nearest whole unit.
Archive retrieved
NOAA IBTrACS archive and Field documentation
Sources & methodology