1958 Western Pacific typhoon season
Typhoon Ida 1958
Typhoon Ida, known in Japan as the Kanogawa Typhoon, caused catastrophic flooding in September 1958. Its pressure measurement set a world tropical-cyclone record at the time, but its deadliest effects came after it weakened and reached Japan. Torrential rain overwhelmed rivers and slopes across the Izu Peninsula and surrounding regions.

Drag to pan. Pinch or Ctrl/⌘ + scroll to zoom. Keyboard: plus or minus to zoom, arrow keys to pan, and 0 to show the full track.
201 mph
Sep 24, 1958 during the tropical stage
Full archive record, including non-tropical stages if present
Along the recorded center positions
STORM HISTORY
A record pressure over the Pacific
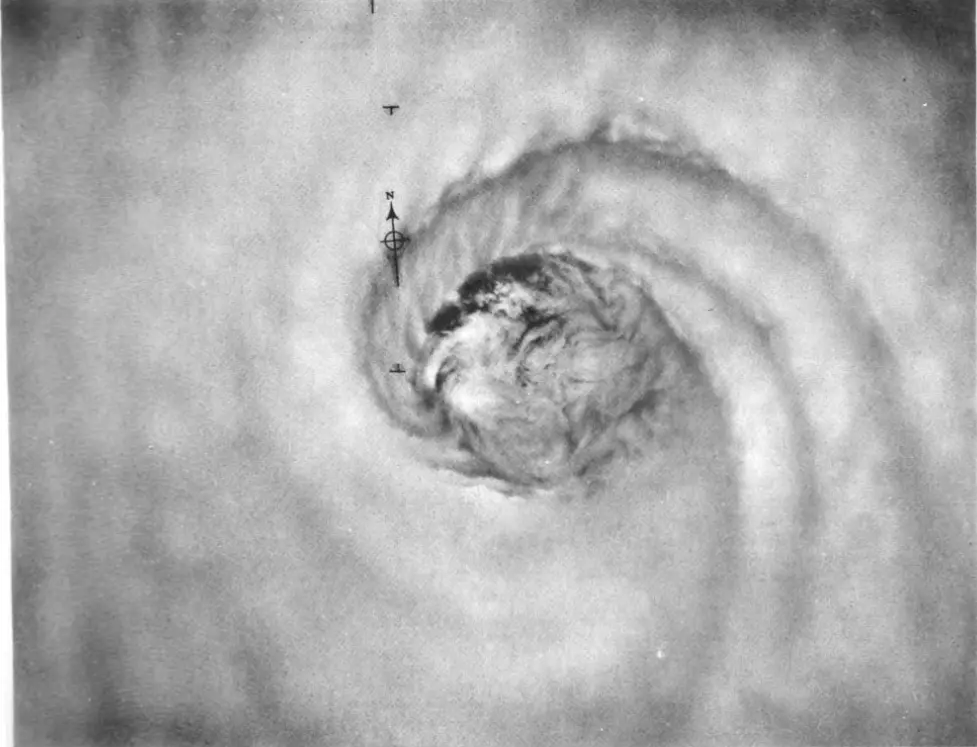
Ida developed near Guam on 20 September and moved west before turning north. Reconnaissance crews observed a rapidly deepening cyclone on 23–24 September. A dropsonde measured 877 hPa, the lowest tropical-cyclone pressure recorded at the time. The current archive places that minimum at 06:00 UTC on 24 September and peak one-minute winds of 175 kt six hours later.
Torrential rain in Japan
Ida weakened as it approached southeastern Honshu on 26 September. Rainfall reached 748.6 mm on Mount Amagi, while Tokyo received nearly 430 mm, its highest daily total since observations began in 1876. Rivers overflowed across the affected region, with especially severe flooding along the Kano River on the Izu Peninsula.
The rain triggered at least 1,900 landslides. Floodwater entered more than 520,000 homes, and the storm destroyed more than 244 road or railway bridges. Power failures and damaged transport links disrupted Tokyo, while broken communications cut off the hardest-hit communities on Izu.
Losses and relief work
The recorded death toll of 1,269 includes 381 people missing and presumed dead. Another 1,138 people suffered injuries, and about 12,000 lost their homes. Damage totaled an estimated US$50 million in 1958 dollars. U.S. military personnel and supplies joined the relief effort after the storm.
Further reading
QUICK ANSWERS
Ida in brief
What was Typhoon Ida's highest wind speed?
201 mph, the highest one-minute sustained wind in its tropical stage, recorded on Sep 24, 1958, 12:00 PM UTC.
What category was Typhoon Ida?
Category 5 at its peak on the Saffir–Simpson one-minute wind scale, first reaching Category 5 on Sep 23, 1958, 09:00 PM UTC. Other agencies classify storms differently.
What was Typhoon Ida's lowest pressure?
877 mb, the minimum central pressure recorded during its tropical stage, on Sep 24, 1958, 06:00 AM UTC.
When did Typhoon Ida occur?
The archived track runs from Sep 20, 1958, 06:00 AM UTC to Sep 29, 1958, 12:00 AM UTC, with the tropical stage from Sep 20, 1958, 12:00 PM UTC to Sep 26, 1958, 09:00 PM UTC.
Where did Typhoon Ida form?
In the Western Pacific basin, in the 1958 season. Its first archived position is 13.5°N, 147.6°E on Sep 20, 1958, 06:00 AM UTC.
Did Typhoon Ida make landfall?
The archive places its center over land at 1 recorded position; the strongest is 81 mph on Sep 26, 1958, 03:00 PM UTC. Positions are six-hourly, so this is not a landfall chronology.
METHODOLOGY
Data sources and limitations
The map and summary are generated from NOAA's IBTrACS v04r01 archive. Wind and category use US-agency records; minimum pressure is calculated during the tropical stage, with the archive's pressure source retained. Category 5 refers to the Saffir–Simpson one-minute wind scale; local agencies may use different classifications. Coastlines use Natural Earth's 1:10m land data.
Track distance adds great-circle distances between consecutive observations, excluding gaps over 12 hours. This track has no gaps over 12 hours. The line shows the storm's center, not its size, rainfall or flood extent. Converted wind speeds are rounded to the nearest whole unit.
Archive retrieved
NOAA IBTrACS archive and Field documentation
Sources & methodology