2005 North Atlantic hurricane season
Hurricane Katrina 2005
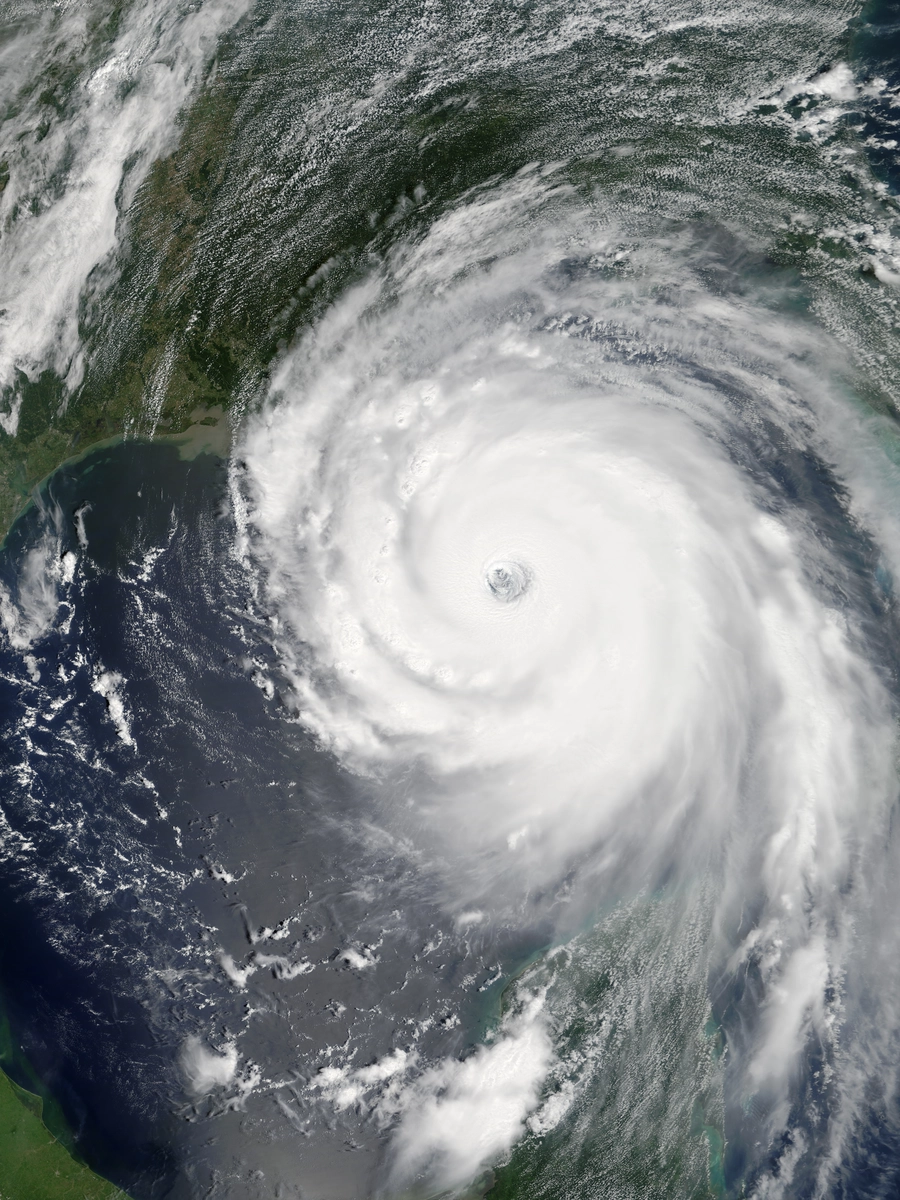
Hurricane Katrina devastated the Gulf Coast in August 2005 after crossing Florida and growing into a vast hurricane over the Gulf of Mexico. In Mississippi, residents lost entire coastal neighborhoods to storm surge. In New Orleans, they faced deep flooding after levees and floodwalls failed. The destruction made Katrina the costliest U.S. hurricane at the time and displaced communities far beyond its landfall points.

Drag to pan. Pinch or Ctrl/⌘ + scroll to zoom. Keyboard: plus or minus to zoom, arrow keys to pan, and 0 to show the full track.
173 mph
Aug 28, 2005 during the tropical stage
Full archive record, including non-tropical stages if present
Along the recorded center positions
STORM HISTORY
Katrina's path from the Bahamas to the Gulf Coast
Katrina began as a tropical depression over the southeastern Bahamas on August 23. Forecasters named it Tropical Storm Katrina the next day. As it approached Florida, the storm turned west and strengthened into a hurricane less than two hours before landfall.
On August 25, Katrina crossed the coast near the Miami-Dade–Broward county border with sustained winds of 70 knots, about 80 mph. Its strongest winds and heaviest rain fell south and east of the center, across Miami-Dade County. After about six hours over land, much of it across the Everglades, Katrina entered the Gulf of Mexico north of Cape Sable on August 26.
Over the Gulf, Katrina regained hurricane strength and grew into a much larger storm. It reached Category 3 on August 27, then Category 5 on August 28. At 18:00 UTC that day, the best-track record places its peak winds at 150 knots and its minimum central pressure at 902 millibars. The archived IBTrACS observations preserve that peak.
Where did Hurricane Katrina make landfall?
Katrina made three U.S. landfalls: southeastern Florida on August 25 as a Category 1 hurricane, followed on August 29 by Buras, Louisiana, and the Louisiana–Mississippi border near the mouth of the Pearl River, both at Category 3 strength.
Katrina reached Buras at about 6:10 a.m. Central Daylight Time. It then crossed southeastern Louisiana and continued toward the Mississippi coast. Changes within its eyewall had reduced its maximum winds, but its broad wind field remained.
Storm surge and the flooding of New Orleans
Along a roughly 20-mile stretch of the Mississippi coast around St. Louis Bay, survey teams found evidence of storm surge about 24 to 28 feet high. They recorded the highest surge mark, 27.8 feet, at Pass Christian. Water reached at least six miles inland in parts of coastal Mississippi and crossed Interstate 10 in several places.
In New Orleans, rising water overtopped or breached sections of the levees and floodwalls. Floodwater entered through failures along the Industrial, London Avenue and 17th Street canals, among other locations. Within about a day of landfall, water covered roughly 80% of the city, reaching depths of about 20 feet in some areas.
Katrina's enormous size helps explain the surge. Its winds pushed water toward the coast across a broad area, while waves generated during its stronger phase added to water levels. The drop from Category 5 to Category 3 measured a decline in maximum wind speed; residents along the coast still faced deep, destructive flooding.
Death toll, damage and inland impacts
In its January 2023 revision, the NHC reported 1,392 Katrina-related fatalities: 520 direct deaths, 565 indirect deaths and 307 deaths with an indeterminate cause. Its damage estimate of $125 billion covers the United States and uses 2005 dollars.
Along the Mississippi coast, residents lost thousands of homes and businesses to the surge. Away from the flooded shoreline, falling trees damaged houses and power lines. In northern Alabama, emergency managers reported hours of tropical-storm-force gusts, downed trees and thousands of people without power.
Across the affected region, about three million people lost electricity, some for weeks. Floods blocked major roads into New Orleans, and Katrina destroyed bridges along the northern Gulf Coast, including the Interstate 10 Twin Span crossing between New Orleans and Slidell. As the storm moved inland, it weakened to a tropical storm over Mississippi, then to a tropical depression over the Tennessee Valley on August 30.
US impacts by state
Selected NOAA Storm Events records for hurricane, tropical storm and storm surge events during this storm's archived track. Deaths and injuries include reported direct and indirect impacts. These records are incomplete, particularly for indirect deaths, and are not storm-wide totals. Other hazards and impacts outside the US are excluded.
| State or territory | Deaths | Injuries | Property damage (event-year USD) |
|---|---|---|---|
| Alabama | 0 | 8 | Not fully reported |
| Florida | 6 | 0 | Not fully reported |
| Georgia | 0 | 0 | Not fully reported |
| Louisiana | 816 | 0 | $16,929,430,000.00 |
| Mississippi | 181 | 104 | Not fully reported |
| Tennessee | 0 | 0 | Not fully reported |
Property damage is reported in dollars of the event year, without inflation adjustment; crop damage is excluded. A missing value is not zero. These figures do not replace the storm-wide estimates elsewhere on this page.
Source: NOAA NCEI Storm Events Database.
Further reading
Official report (PDF) — National Hurricane Center, Tropical Cyclone Report.
QUICK ANSWERS
Katrina in brief
What was Hurricane Katrina's highest wind speed?
173 mph, the highest one-minute sustained wind in its tropical stage, recorded on Aug 28, 2005, 06:00 PM UTC.
What category was Hurricane Katrina?
Category 5 at its peak on the Saffir–Simpson one-minute wind scale, first reaching Category 5 on Aug 28, 2005, 12:00 PM UTC. Other agencies classify storms differently.
What was Hurricane Katrina's lowest pressure?
902 mb, the minimum central pressure recorded during its tropical stage, on Aug 28, 2005, 06:00 PM UTC.
When did Hurricane Katrina occur?
The archived track runs from Aug 23, 2005, 06:00 PM UTC to Aug 31, 2005, 06:00 AM UTC, with the tropical stage from Aug 23, 2005, 06:00 PM UTC to Aug 30, 2005, 09:00 PM UTC.
Where did Hurricane Katrina form?
In the North Atlantic basin, in the 2005 season. Its first archived position is 23.1°N, 75.1°W on Aug 23, 2005, 06:00 PM UTC.
Did Hurricane Katrina make landfall?
Yes. The NHC report records 3 US landfalls: Southeast Florida on Aug 25, 2005 (81 mph, Category 1); Buras, Louisiana on Aug 29, 2005 (127 mph, Category 3); Louisiana–Mississippi border on Aug 29, 2005 (121 mph, Category 3).
How many people died in Hurricane Katrina?
1,392 deaths are recorded by NHC Tropical Cyclone Report (2023 revision; direct, indirect and indeterminate deaths).
How much damage did Hurricane Katrina cause?
NHC Tropical Cyclone Report (2023 revision) records USD 125,000,000,000 in damage (2005).
METHODOLOGY
Data sources and limitations
The map and summary are generated from NOAA's IBTrACS v04r01 archive. Wind and category use US-agency records; minimum pressure is calculated during the tropical stage, with the archive's pressure source retained. Landfall details are separately checked against the NHC report. Coastlines use Natural Earth's 1:10m land data.
Track distance adds great-circle distances between consecutive observations, excluding gaps over 12 hours. This track has no gaps over 12 hours. The line shows the storm's center, not its size, rainfall or flood extent. Converted wind speeds are rounded to the nearest whole unit.
Archive retrieved ; landfalls reviewed 11 September 2026
NOAA IBTrACS archive and Field documentation
Sources & methodology