2014 Eastern Pacific hurricane season
Hurricane Marie 2014
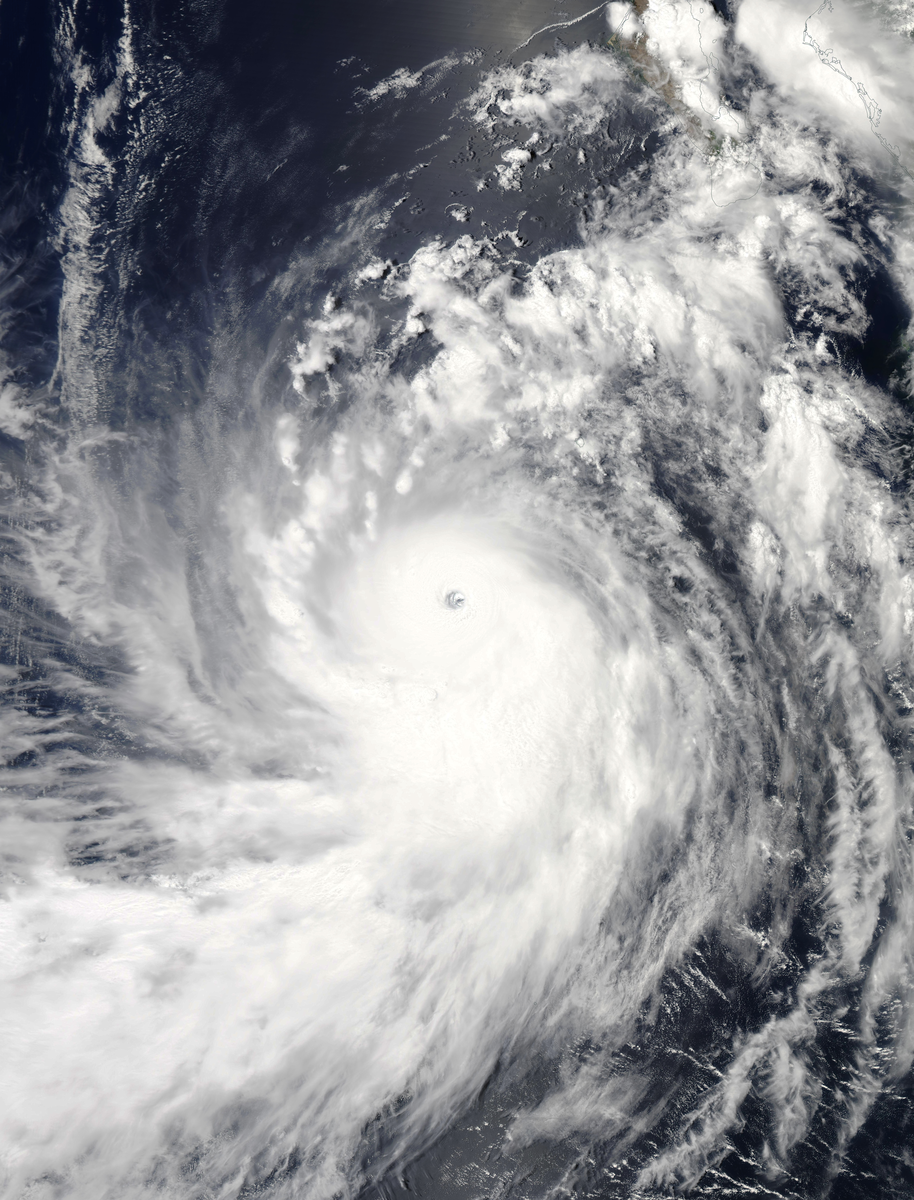
Marie's center stayed far offshore, but its large wind field sent damaging surf toward Mexico and California. The hurricane briefly reached Category 5 strength before weakening over cooler water.

Drag to pan. Pinch or Ctrl/⌘ + scroll to zoom. Keyboard: plus or minus to zoom, arrow keys to pan, and 0 to show the full track.
161 mph
Aug 24, 2014 during the tropical stage
Full archive record, including non-tropical stages if present
Along the recorded center positions
STORM HISTORY
A large hurricane south of Mexico
Marie developed south-southeast of Acapulco on August 22 and became a hurricane the next day. An eye formed on August 24, followed by rapid intensification. The archive records peak sustained winds of 140 knots and a central pressure of 918 millibars that evening.
At its peak, Marie's tropical-storm-force winds extended across an area about 925 kilometers wide. An eyewall replacement cycle began its decline, followed by cooler water and a more stable atmosphere. The weakening circulation persisted offshore into early September.
Dangerous surf far from the center
Three people drowned when a boat capsized off Los Cabos, while outer-band flooding caused two deaths in Colima and Oaxaca. Farther north, large swells damaged coastal structures on Santa Catalina Island and around Los Angeles. A Long Beach breakwater sustained about US$10 million in damage.
One person drowned near Malibu, where rescuers carried out more than 100 ocean rescues. Total losses were estimated at US$20 million in 2014 dollars, despite the absence of a landfall.
IMPACT
Reported impact
| Areas affected | United States |
|---|
Facts from Wikidata.
Further reading
NOAA IBTrACS v04r01 historical track archive
Wikipedia, Hurricane Marie (2014)
Official report (PDF) — National Hurricane Center, Tropical Cyclone Report.
QUICK ANSWERS
Marie in brief
What was Hurricane Marie's highest wind speed?
161 mph, the highest one-minute sustained wind in its tropical stage, recorded on Aug 24, 2014, 06:00 PM UTC.
What category was Hurricane Marie?
Category 5 at its peak on the Saffir–Simpson one-minute wind scale, first reaching Category 5 on Aug 24, 2014, 06:00 PM UTC. Other agencies classify storms differently.
What was Hurricane Marie's lowest pressure?
918 mb, the minimum central pressure recorded during its tropical stage, on Aug 24, 2014, 06:00 PM UTC.
When did Hurricane Marie occur?
The archived track runs from Aug 22, 2014, 12:00 AM UTC to Sep 2, 2014, 06:00 AM UTC, with the tropical stage from Aug 22, 2014, 12:00 AM UTC to Aug 28, 2014, 03:00 PM UTC.
Where did Hurricane Marie form?
In the Eastern Pacific basin, in the 2014 season. Its first archived position is 12.3°N, 98.8°W on Aug 22, 2014, 12:00 AM UTC.
Did Hurricane Marie make landfall?
No archived position places Hurricane Marie's center over land, but positions are six-hourly and a brief landfall can fall between them.
METHODOLOGY
Data sources and limitations
The map and summary are generated from NOAA's IBTrACS v04r01 archive. Wind and category use US-agency records; minimum pressure is calculated during the tropical stage, with the archive's pressure source retained. Category 5 refers to the Saffir–Simpson one-minute wind scale; local agencies may use different classifications. Coastlines use Natural Earth's 1:10m land data.
Track distance adds great-circle distances between consecutive observations, excluding gaps over 12 hours. This track has no gaps over 12 hours. The line shows the storm's center, not its size, rainfall or flood extent. Converted wind speeds are rounded to the nearest whole unit.
Archive retrieved
NOAA IBTrACS archive and Field documentation
Sources & methodology