2005 North Atlantic hurricane season
Hurricane Wilma 2005
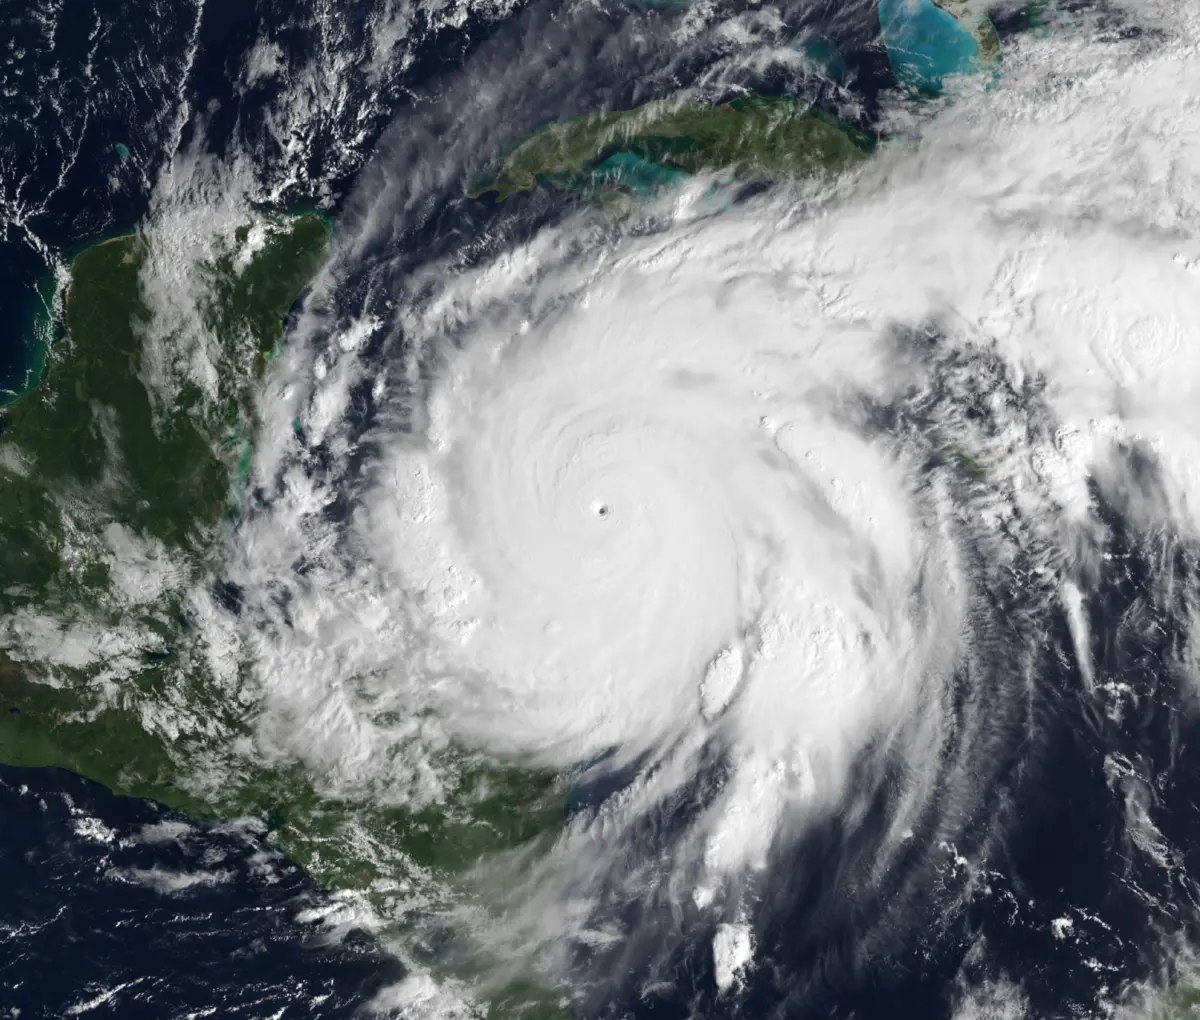
Hurricane Wilma set the Atlantic's minimum-pressure record during explosive strengthening in October 2005. It then battered the Yucatán Peninsula before accelerating across South Florida as a major hurricane.

Drag to pan. Pinch or Ctrl/⌘ + scroll to zoom. Keyboard: plus or minus to zoom, arrow keys to pan, and 0 to show the full track.
184 mph
Oct 19, 2005 during the tropical stage
Full archive record, including non-tropical stages if present
Along the recorded center positions
STORM HISTORY
A tiny eye and record pressure
Wilma developed near Jamaica on October 15 and became a hurricane on October 18. Its central pressure fell 97 hPa in 24 hours as the eye contracted to roughly 2.3 miles across. On October 19, the archive records maximum one-minute winds of 160 kt and a minimum central pressure of 882 hPa.
From the Yucatán to Florida
Wilma weakened from its peak before reaching the Yucatán Peninsula, where its slow passage brought destructive winds, rain and surge. It damaged nearly 29,000 homes and 473 schools in Mexico. After emerging over the Gulf, it turned northeast and strengthened again.
The hurricane reached Cape Romano, Florida, on October 24 with winds near 120 mph, at Category 3 strength. It crossed South Florida, weakened briefly and then regained major-hurricane strength over the Atlantic before racing northeast and becoming extratropical.
Destruction around the western Caribbean
Wilma's effects extended beyond its landfalls. Floods and landslides caused deaths in Haiti and Jamaica, while surge and waves damaged homes and infrastructure in Cuba and the Bahamas. In Florida, coastal flooding and strong winds damaged tens of thousands of properties. The saved account estimates total damage at US$26.5 billion in 2005 currency.
IMPACT
Reported impact
| Deaths | 87 |
|---|
Facts from Wikidata.
US impacts by state
Selected NOAA Storm Events records for hurricane, tropical storm and storm surge events during this storm's archived track. Deaths and injuries include reported direct and indirect impacts. These records are incomplete, particularly for indirect deaths, and are not storm-wide totals. Other hazards and impacts outside the US are excluded.
| State or territory | Deaths | Injuries | Property damage (event-year USD) |
|---|---|---|---|
| Delaware | 0 | 0 | Not fully reported |
| Florida | 5 | 0 | Not fully reported |
| New Jersey | 0 | 0 | Not fully reported |
Property damage is reported in dollars of the event year, without inflation adjustment; crop damage is excluded. A missing value is not zero. These figures do not replace the storm-wide estimates elsewhere on this page.
Source: NOAA NCEI Storm Events Database.
Further reading
NOAA IBTrACS v04r01 historical track archive
Official report (PDF) — National Hurricane Center, Tropical Cyclone Report.
QUICK ANSWERS
Wilma in brief
What was Hurricane Wilma's highest wind speed?
184 mph, the highest one-minute sustained wind in its tropical stage, recorded on Oct 19, 2005, 12:00 PM UTC.
What category was Hurricane Wilma?
Category 5 at its peak on the Saffir–Simpson one-minute wind scale, first reaching Category 5 on Oct 19, 2005, 03:00 AM UTC. Other agencies classify storms differently.
What was Hurricane Wilma's lowest pressure?
882 mb, the minimum central pressure recorded during its tropical stage, on Oct 19, 2005, 12:00 PM UTC.
When did Hurricane Wilma occur?
The archived track runs from Oct 15, 2005, 06:00 PM UTC to Oct 26, 2005, 06:00 PM UTC, with the tropical stage from Oct 15, 2005, 06:00 PM UTC to Oct 25, 2005, 09:00 PM UTC.
Where did Hurricane Wilma form?
In the North Atlantic basin, in the 2005 season. Its first archived position is 17.6°N, 78.5°W on Oct 15, 2005, 06:00 PM UTC.
Did Hurricane Wilma make landfall?
The archive places its center over land at 2 recorded positions; the strongest is 133 mph on Oct 22, 2005, 03:00 AM UTC. Positions are six-hourly, so this is not a landfall chronology.
How many people died in Hurricane Wilma?
87 deaths are recorded by Wikidata.
METHODOLOGY
Data sources and limitations
The map and summary are generated from NOAA's IBTrACS v04r01 archive. Wind and category use US-agency records; minimum pressure is calculated during the tropical stage, with the archive's pressure source retained. Category 5 refers to the Saffir–Simpson one-minute wind scale; local agencies may use different classifications. Coastlines use Natural Earth's 1:10m land data.
Track distance adds great-circle distances between consecutive observations, excluding gaps over 12 hours. This track has no gaps over 12 hours. The line shows the storm's center, not its size, rainfall or flood extent. Converted wind speeds are rounded to the nearest whole unit.
Archive retrieved
NOAA IBTrACS archive and Field documentation
Sources & methodology